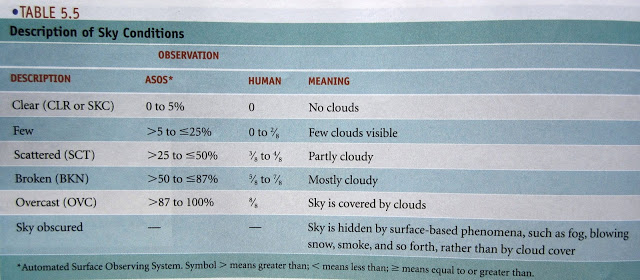
 |
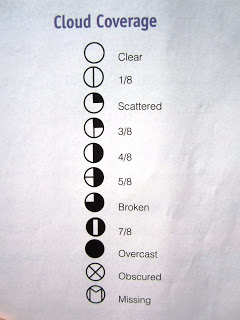
| Chart from Meteorology Today, 8th Ed., by Donald Ahrens. |
The chart above shows the official symbols used by meteorologist on weather charts and maps. This is a pretty funny chart; it reads like a joke--one that doesn't make much sense, but has a great punch line. I understand the symbol for clear, 4/8, and overcast. The others aren't instantly comprehensible.
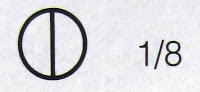 |
| Looks more like 1/2 to me. |
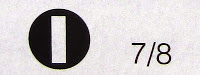 |
| Looks like international symbol for an information kiosk. |
And then there is the big M for Missing. I am sure this refers to missing data, but I had to laugh. Where would you look for a missing sky?
 |
| Lucy, you got some 'splainin' to do. |
But seriously...when used in combination with the table below, these symbols make you realize that it doesn't take many clouds to make cloudy. A sky
covered by graced by--more than 25% clouds is cloudy. And "cloudy" has such negative connotations. Which is too bad. Cloudful would be more a better adjective.
 |
| I took this photo around 3 p.m. Monday. A classic example of altostratus clouds over Budd Inlet. The National Weather Service report from Olympia Airport listed the clouds as Few and Scattered (SCT). Hmmmm.... |
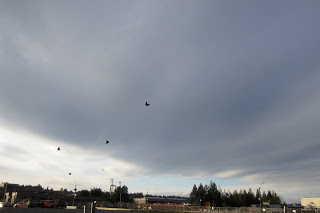 |
| This photo shows the western edge of the cloud bank above--skies starting to clear. The National Weather Service did not mention the crows--few and scattered. |